Breaking Down the True Cost of Manual Franchise Reporting
Nobody puts manual reporting on a P&L. That is precisely why it costs so much.
Nobody has ever written “manual reporting” as a line on a franchise P&L. Which is the whole problem.
Head offices budget for the things they can see. Ad spend. Salaries. Rent. The cost of chasing forty franchisees for their numbers, rekeying them into a spreadsheet, and rebuilding the same deck every month sits nowhere. Untracked. Unquestioned. And large. It does not appear because it is spread thin — an hour here, a morning there, a manager’s Monday — across people who were hired to do something else. Distributed cost is invisible cost. That does not make it small.
The honest answer is the cost of manual reporting was never the reporting. It is the decisions you make late — or wrong — because the data landed slow and stale.
Picture the Monday pack. Someone at head office emails forty franchisees for last week’s numbers. Thirty reply, in five different formats. The other ten need chasing twice. The figures get pasted into a master sheet, a column breaks, a total looks wrong, and an hour goes on working out why. By the time the deck is ready, the week it describes is already gone. That is not a one-off. That is Monday, every week, forever.
Where the hours actually go
Ask a head-office team where a reporting week goes and you will hear “pulling it together.” Break that apart and almost none of it is analysis.
Anatomy of a manual reporting month (HQ time)
Illustrative breakdown. Time-waste framing: Asana Anatomy of Work Index — UK knowledge workers spend just 27% of time on skilled work.
You are not paying for reports. You are paying for the 92% of the process that is not analysis.
The Asana Anatomy of Work Index puts it starkly: across the UK, knowledge workers spend just 27% of their time on skilled work, and lose 227 hours a year to duplicated effort alone. A reporting process built on spreadsheets and chasing is that statistic, wearing a franchise lanyard.
It gets worse. The same research found UK workers lose 157 hours a year to unnecessary meetings — and in most head offices a good share of those are meetings about the reports. First you spend days building the numbers. Then you spend hours in a room explaining numbers that are already out of date. Reporting does not end when the spreadsheet is finished. It ends when the meeting about the spreadsheet is finished.
The number nobody sees
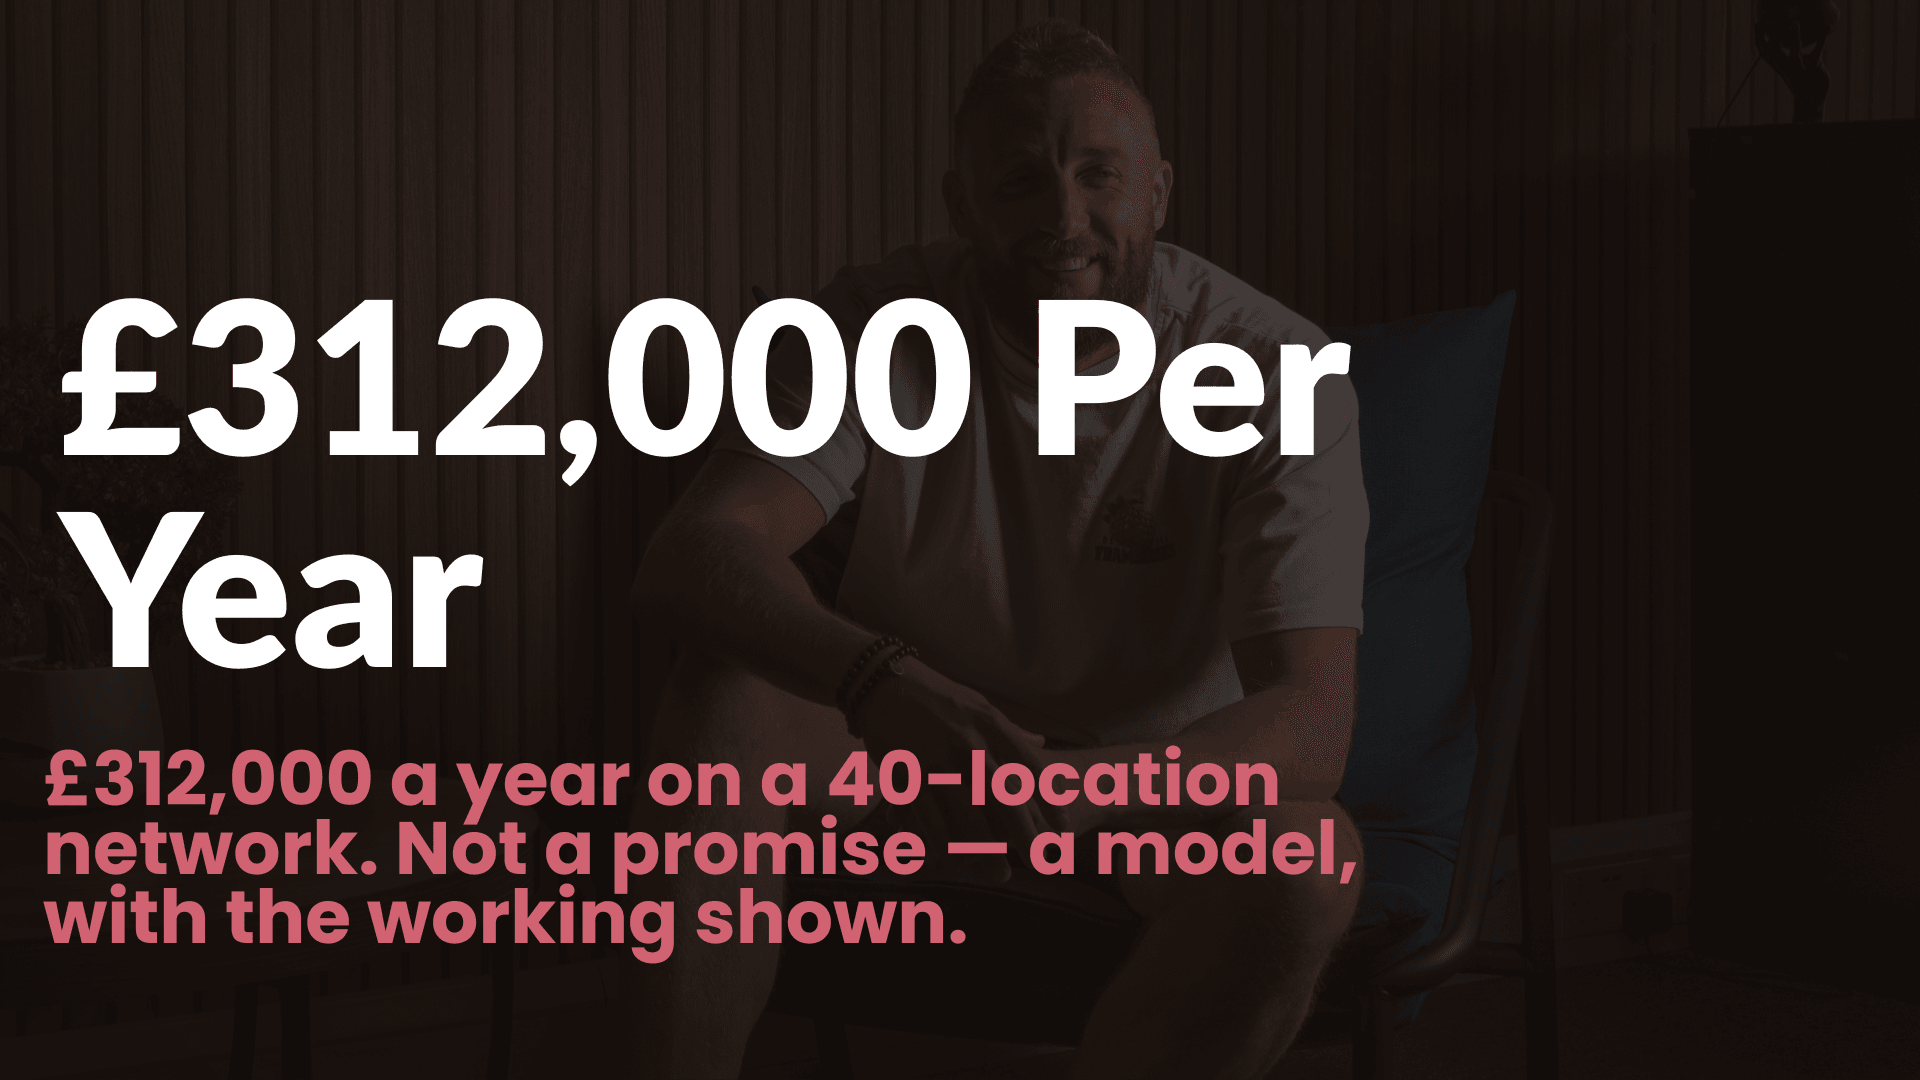
Put a figure on it. Say head office spends the equivalent of two days a month producing the network report — chasing, consolidating, formatting, correcting. Across a year that is roughly six working weeks of senior time on a task that grows nothing by itself. Now scale it. At forty units it is a nuisance. At sixty it is a job. The reporting burden does not rise in a straight line with the network — every new franchisee is another source to chase, another format to reconcile, another row where something can break. Manual reporting is the one part of a franchise that gets harder, not easier, the more successful you become. It is one of four leaks we costed in the full £312,000 breakdown.
Time on skilled work
27%
What UK knowledge workers actually spend on the job they were hired for. Source: Asana Anatomy of Work Index.
Lost to duplicated work
227 hrs
Per person, per year — before you count the meetings about the reports. Source: Asana.
Same applies to the marketing team, the ops lead, the franchise support manager. Every hour spent assembling last month’s numbers is an hour not spent improving next month’s.
The version nobody trusts
There is a second cost hiding underneath the first. When numbers are assembled by hand from forty sources, nobody fully trusts them — and rightly so. A figure gets rekeyed wrong. A franchisee sends last month’s sheet by mistake. Two versions of the master file disagree. A decision waits while someone works out which number is real.
Manual reporting does not just cost time. It costs confidence. A head office that does not quite trust its own numbers hesitates — on interventions, on investment, on which franchisee needs help this month. The slowest decision in the building is the one made on data nobody is sure about.
Slow data is expensive data
Here is the part that actually hurts. Manual reporting is retrospective by design. It arrives monthly, describing a month that has already gone. By the time a dip in one location shows up in a spreadsheet, it is weeks old — and weeks expensive.
The average UK franchise unit turns over £400,000 a year (bfa/NatWest Franchise Survey). A unit drifting for a month before anyone notices is real money — and the franchisor’s management fee, typically 11.2% of that turnover, rides on it. Late data is not an admin inconvenience. It is a revenue leak with a delay timer.
Make it concrete. One unit in a forty-strong network slips 15% below its run-rate. Spotted the same day, it is a phone call and a fixable problem. Spotted five weeks later — the next reporting cycle — it is five weeks of lost turnover on a unit averaging £400,000 a year, plus a franchisee who has now quietly decided the model does not work for them. The reporting delay did not cause the dip. It just guaranteed you found out too late to fix it cheaply.
| Real-time dashboard | Manual monthly reporting | |
|---|---|---|
| Data age | Live | Up to 5 weeks old |
| Time to spot a problem | Same day | Next reporting cycle |
| Error rate | Validated at source | Manual re-keying |
| HQ hours per month | Minutes | Days |
| Scales with network size | Yes | No — gets worse |
What good looks like
Good reporting is not a better spreadsheet. It is no spreadsheet. One source of truth, updated live, that every franchisee feeds automatically and every head-office role sees at the level they need.
That is what we built KORE by SOOM® to do — a custom-built franchise operations platform, not a white-labelled tool and not a generic BI dashboard bent to fit. Real-time KPI reporting, role-based access so head office and franchisees see different views of the same live data, and no monthly scramble. It was built for franchise networks, not adapted for them.
What that changes day to day is simple. Franchisees stop being asked for numbers, because the system already has them. Head office stops building the pack, because the dashboard is the pack. Underperformance surfaces the day it starts, not five weeks later in a slide. And month-end stops being an event, because there is nothing to close — the data was always current.
The point is not that dashboards are nicer than spreadsheets. It is that the entire monthly ritual — the chasing, the rekeying, the formatting, the meeting to explain it — was work created by the tool, not by the business. Remove the tool and most of the work simply stops existing. That is the difference between doing reporting faster and not doing most of it at all.
Where we sit in all of this
We are not above this conversation. We built KORE because we were tired of building the same manual reports for the franchise brands we work with — and watching good operators make decisions on data that was already out of date. Reporting is one invisible cost; slow onboarding is another. See how SOOM approaches franchise marketing, reporting included.
The reporting itself was never the cost. The cost is everything you could not do because the numbers arrived too late to matter.
How old is the data behind your next franchise decision?
Next in this series
What Inefficient Onboarding Is Costing Growing Franchise Brands →
SOOM® helps franchisors turn manual operations into systemised growth. Explore franchise marketing with SOOM →